Live Dashboard for Claude Code Token Usage and Tracker Issues
One command shows token usage, running instances, and open issues with pipeline state — all live, all from the daemon.
How to monitor Claude Code token consumption
Claude Code shows no easy way to see how many tokens you’ve consumed in the current billing window. You’re flying blind until you hit the rate limit. With multiple instances running — one on your host, others inside devcontainers — it’s even worse. Each instance burns through tokens independently, and you have no aggregate view.
One command, full visibility
human tui
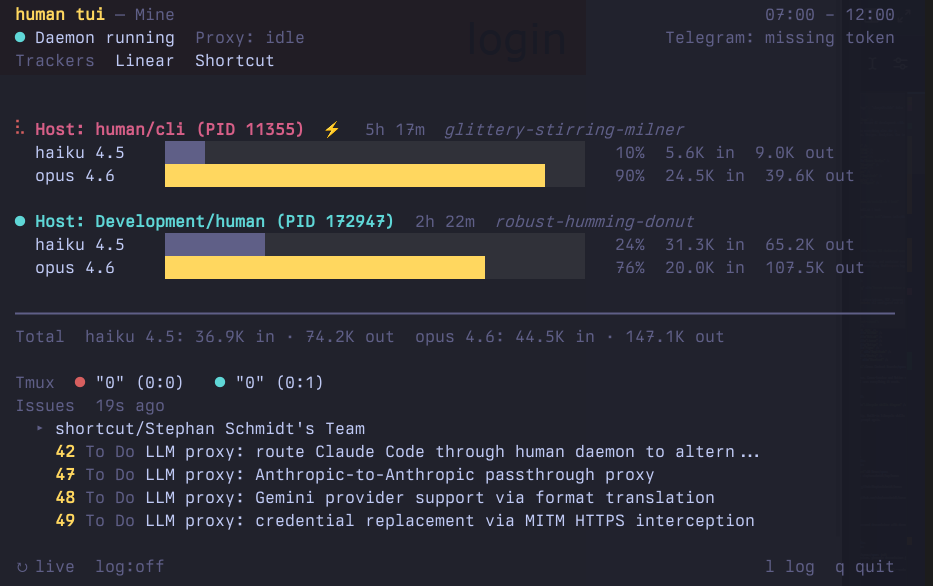
Every Claude Code instance is discovered automatically — host processes via pgrep, Docker containers via the Docker API. No configuration needed.
Live busy/ready state
Each instance shows its current state with a colored dot:
- 🟢 Ready — Claude has finished and is waiting for input
- 🔴 Busy — Claude is processing a request or waiting for tool results
- ⚪ Unknown — state could not be determined
Busy instances also show their running subagents — agent name, type, and elapsed time — so you can see exactly what each instance is working on.
Per-model breakdown
Token usage is broken down by model family and version. Each instance shows per-model bars with percentages, input token counts, and output token counts. The Total line at the bottom aggregates across all instances.
5-hour billing windows
Claude Code’s rate limits operate on rolling 5-hour UTC windows:
00:00–05:00 05:00–10:00 10:00–15:00 15:00–20:00 20:00–00:00
human tui automatically selects the current window and scans only the relevant JSONL entries. You see exactly what counts against your current limit.
Aggregate Claude Code usage across devcontainers
human tui finds every running Claude Code instance without configuration:
Host instances — detected via pgrep claude. Multiple host processes sharing the same ~/.claude/projects directory are deduplicated.
Docker containers — detected via the Docker API. Each running container is checked for a claude process. If found, JSONL data is streamed from the container for analysis. Container names and short IDs are shown in the label.
When only one instance is found, the output uses the simpler single-instance format without labels. Multiple instances trigger the multi-instance view with per-instance sections and an aggregated total.
Works in devcontainers
Run human tui from your host to see all instances including those running inside devcontainers. The Docker API handles container discovery and data streaming automatically — no daemon, no port forwarding, no extra setup.
Tracker issues and pipeline state
The human tui dashboard shows open issues from all connected trackers, with pipeline state that maps tracker statuses to meaningful stages:
PM pipeline (Shortcut, Jira, etc.):
- Ready for Plan — ticket exists, waiting for engineering plan
- Planning — plan is being created
- Planned — plan complete, ready for development
Engineering pipeline (Linear, GitHub, etc.):
- Backlog — engineering ticket exists, not started
- In Dev — implementation in progress
- Done — implementation complete
Issues are fetched through the daemon, which holds all tracker credentials. The TUI shows the daemon’s actual credential state — what the daemon can access is what you see.
Each tracker group shows a PM or Eng label to distinguish product from engineering work. Status is color-coded: grey for waiting, yellow for in-progress, teal for complete.